- What is Support and Resistance?
- Why Support and Resistance Levels Are Effective
- How to Identify Support and Resistance?
- How to Draw Support and Resistance Perfectly?
- Types of Support and Resistance
- Trendlines: The Dynamic Support and Resistance
- Moving Averages: The Dynamic Support and Resistance
- Fibonacci Levels: Nature’s Blueprint in the Market
- Psychological Levels: The Magic of Round Numbers
- How to Trade Support and Resistance?
- Advanced Techniques for Support and Resistance
- FAQ: Support and Resistance in Stock Market
- Q1. What is Support in the Stock Market?
- Q2. What is Resistance in the Stock Market?
- Q3. Why are Support and Resistance Important?
- Q4. Can Support Become Resistance and Vice Versa?
- Q5. How Can I Identify Support and Resistance Levels?
- Q6. Do Support and Resistance Work for All Timeframes?
- Q7. Is Support and Resistance a Guarantee?
- Q8. How Do Traders Use Support and Resistance in Trading?
- Conclusion
- Disclaimer:
Of all the concepts in stock market trading, few are as vital and widely applied as Support and Resistance. Two mere words that may seem simple on paper, but if used appropriately, have the potential to revolutionize your whole approach towards trading. Whether you’re an intraday trader, a swing trader, or a long-term investor, learning support and resistance is your starting point in deciphering the charts’ language.
In this guide, we will dive deep into the essence of support and resistance, how to apply it, how to draw it flawlessly, and most importantly, how to trade it like professional traders. I will also provide you with real-world examples and tricks to enhance your trading strategy. So, let’s begin!
What is Support and Resistance?
Let’s begin with the fundamentals, just the way a veteran trader would do it for a friend over chai in the office pantry or a cup of filter coffee at home on a weekend morning. Support is like the floor of your house — the point where you don’t fall any lower. It is the level of price at which demand is sufficiently strong to stop the price from declining further.
As soon as the stock hits this level, buyers find the price appealing, and they begin to buy, which drives the stock up. Resistance is similar to the ceiling — it restricts how high you can jump.
This is the price level at which sellers believe that the price is too high and they begin to sell, arresting the price’s rise above it. These are natural levels, and all financial instruments exhibit these patterns — whether a stock, commodity, cryptocurrency, or even a forex pair. Why they are interesting is that they are created by the emotions of millions of traders like you and me — greed, fear, hope, regret, and patience.
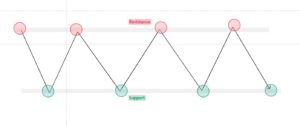
Image 1.1
Support is like the floor of your house — the point where you stand firm and don’t fall any further. It is the price level where demand is strong enough to prevent the price from falling further. Whenever the stock reaches this level, buyers feel the price is attractive, and they start buying, which pushes the stock higher.
Resistance is like the ceiling — it limits how high you can jump. This is the price level where sellers think the price has gone too high and they start selling, preventing the price from rising beyond that point.
These levels are natural, and every financial instrument shows these patterns — be it a stock, commodity, cryptocurrency, or even forex pair. What makes them fascinating is that they are formed by the emotions of millions of traders like you and me — greed, fear, hope, regret, and patience.
Why Support and Resistance Levels Are Effective
Do you ever notice a cricket game where a batsman is stuck at a specific kind of delivery and the bowler continues to attack that weak point? Stock markets are also somewhat like that. Some price points serve as good psychological markers for investors and traders. Picture this: you see the Reliance stock touching ₹3000 several times but never go beyond it. Subtly, you begin to feel ₹3000 is “too high” for the stock, and you don’t buy it at or above that price. Sellers begin to appear near that price point repeatedly, and the stock is forced lower.
In the same way, if the stock keeps dipping to ₹2500 but comes back, the market as a whole perceives it as a support area. Investors muster courage to buy the stock at that price level, taking it higher each time. Such responses are due to human experience and memory, which is why support and resistance levels are so strong and dependable.
How to Identify Support and Resistance?
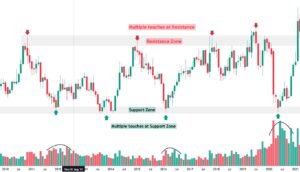
Spotting these zones isn’t rocket science, but it does require a bit of patience and observation. The first step is to clear the clutter from your chart. Too many indicators will cloud your judgment. Use clean price charts and shift to higher timeframes, such as weekly and daily charts. Look for places where price has repeatedly reversed direction, these are the important swing points. After they are identified, draw horizontal lines denoting these zones. Keep in mind, they are zones, not exact numbers.
Price can marginally overshoot or undershoot these levels; thus, always leave a buffer. The more the price touches and responds to a specific level, the greater the level of support or resistance. It’s similar to testing a wall: the more it resists, the stronger you realize it is.
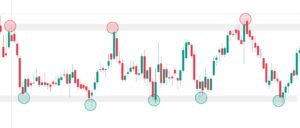
Image 1.2
Clean the Chart: Open your charting software and remove all unnecessary indicators, lines, and noise.
- Select Higher Timeframes: Weekly and Daily charts provide the most reliable support and resistance levels. Start here before zooming into smaller timeframes like 4-hour or 1-hour.
- Swing Points: Look for areas where the price has reversed direction — these are usually strong levels of support or resistance.
- Horizontal Lines: Draw horizontal lines across those price zones where multiple reversals occurred.
- Zone vs. Line: Treat these as zones, not specific price points. Prices rarely respect a single digit level; it’s usually a range.
- Test and Retest: Levels that have been tested multiple times become stronger, as each test reconfirms that the level matters.
Real Chart Example: Reliance Industries (Weekly Timeframe)
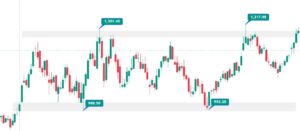
Image 1.3
Let’s take a real-world example from Reliance Industries to make this concept even more clear.
When you look at Reliance’s weekly chart, you’ll notice a classic support and resistance setup. The stock found strong support in the ₹981 to ₹998 zone. Every time the price dipped into this range, buyers stepped in with confidence and the stock bounced back beautifully. It’s like the market had silently agreed, “Below ₹1000, Reliance is too good a deal to miss!”
On the flip side, the ₹1300 to ₹1317 zone acted as a tough resistance. Each time the stock tried climbing above this range, it faced heavy selling pressure and got pushed back down. Sellers were clearly waiting around this level, locking in their profits.
This simple yet powerful price behavior shows how support and resistance work in real trading — once you learn to spot these zones, your chart-reading skills instantly level up.
How to Draw Support and Resistance Perfectly?
Perfection in trading is always an elusive target, but you can get quite close by practicing. Begin with the higher timeframes, as weekly and daily levels carry more weight than intraday levels. Use historical swing highs and lows as your reference. In drawing the line, some use candle wicks, while others use candle bodies.
Both are acceptable; the important thing is to observe the area where price has reacted the most. Project these levels forward and use them as zones with a buffer. The more that a price tests a level, the stronger it becomes. If large volumes are seen at these levels, that further confirms their significance.
Higher Timeframes First: Weekly and Daily levels matter more than hourly ones.
Image 1.4 : how to draw support and resistance perfectly.
- Connect Wicks and Bodies: Some traders draw lines on candle wicks, others on candle bodies. The truth is both are useful — try to see where price reversed most frequently and focus there.
- Turn Lines Into Zones: Give your support and resistance a range of 0.5% to 1% buffer on either side. This accounts for market noise and false spikes.
- Volume Analysis: High volume near a level validates its importance.
- Multiple Tests: The more times price tests a level, the stronger the level becomes. After 3 or more touches, the level is considered highly reliable.
Types of Support and Resistance
Support and resistance aren’t always horizontal. There are several types, each for a different reason. Horizontal levels are the traditional ones, where price has reversed before. Trendlines introduce a dynamic twist, depicting diagonal support and resistance that change with time. Moving averages like 50-day or 200-day act as dynamic supports and resistances too. Fibonacci retracement levels, calculated mathematically, often line up beautifully with actual price reversals. Then there are psychological levels, e.g., round numbers or significant milestones. Naturally, traders place their orders around those because it feels good to use “big figure” prices.
Horizontal Levels: These are based on historical price reactions — swing highs and swing lows. This is the most commonly used type.
Trendlines: The Dynamic Support and Resistance
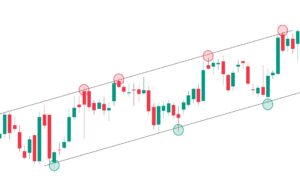
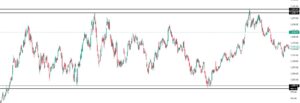
Support and resistance aren’t always horizontal! When a stock is moving in a clear trend — whether it’s climbing higher or sliding lower — trendlines come into play. These are slanted lines that connect either the swing lows (in an uptrend) or swing highs (in a downtrend). As long as the price respects the trendline, it acts like a moving support or resistance zone, guiding the direction of the stock.
For example, in the image below, you’ll notice how the stock price bounced multiple times from an upward sloping trendline, using it as a dynamic support during its rally. Similarly, once the price breaks a trendline, that same line often flips its role — turning from support into resistance, or vice versa. Trendlines give traders a visual map of the market’s ongoing momentum.
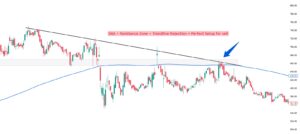
Moving Averages: The Dynamic Support and Resistance
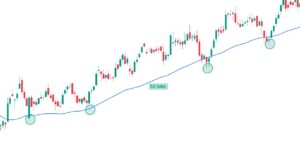
Sometimes the price doesn’t just bounce from horizontal lines or trendlines — it also respects moving indicators like the 50-day or 20-day Simple Moving Averages (SMA). These moving averages act as dynamic support and resistance zones, especially on higher timeframes. When a stock is trading above its 50-day or 200-day SMA, the moving average often acts like a cushion, where buyers step in to defend the price. On the flip side, when the stock is trading below these lines, the SMA can act like a ceiling, making it hard for the price to climb further.
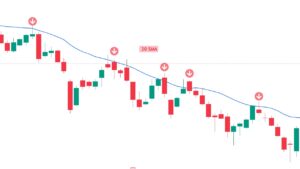
For example, many traders watch the 20-day SMA closely; when a stock approaches this line from above, it often finds support and bounces. But once it breaks below the 20-day, the same level can become a strong resistance during any pullback. This is why moving averages are so popular — they help smooth out price action and highlight key zones where the market might react.
Fibonacci Levels: Nature’s Blueprint in the Market
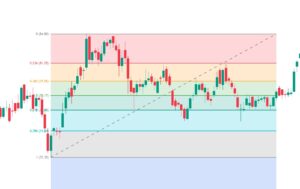
Fibonacci levels are like the hidden geometry of the stock market — calculated using ratios such as 38.2%, 50%, and 61.8%, these retracement levels often act as natural support and resistance zones. After a big move, prices tend to pull back and “cool off” around these magic numbers before continuing their journey. Traders across the world — whether it’s equities, forex, or crypto — use Fibonacci retracements to spot potential bounce zones or reversal points.
For example, in the chart I’ve shared below, the stock retraced exactly to the 61.8% Fibonacci level — and this acted as a textbook strong support zone. Once the price hit this level, buyers stepped in and the stock beautifully bounced back from there. This is the power of Fibonacci; even when no news or obvious reasons are present, the market often respects these levels, almost like it’s following its own natural rhythm.
Psychological Levels: The Magic of Round Numbers
Sometimes the market doesn’t need fancy indicators or deep technical analysis — plain old round numbers do the trick! These are called psychological levels. Prices like ₹500, ₹1000, ₹1300, or ₹5000 often act as invisible walls for stocks. Why? Because traders and investors naturally gravitate toward these numbers when placing their buy or sell orders. It’s human behavior — round numbers just “feel” right.
For example, if you look at Reliance’s price movement, you’ll notice the stock often struggled between the ₹1000 and ₹1300 zone. Buyers tend to get active when the stock approaches ₹1000, and on the other hand, sellers often start booking profits as it nears ₹1300. These round-number levels silently shape the market, even though they seem simple on the surface.
How to Make Support and Resistance More Effective?
The real trick is not in drawing these levels but in using them effectively. Always wait for confirmation before taking a trade. Price approaching a level is not enough; you need to see how it reacts at that level. Look for candlestick patterns like pin bars, hammers, or engulfing candles for validation. Volume confirmation adds another layer of safety. Confluence — where multiple signals agree on the same level — dramatically improves the probability of success. Planning your risk-reward before the trade and using multiple timeframe analysis are also essential ingredients for success.
Now let’s talk about the real skill: how to actually use these levels to trade like a seasoned professional.
Wait for Confirmation: Don’t jump into trades just because price reaches a level. Look for reversal candlestick patterns like a pin bar, hammer, or bullish/bearish engulfing candle.
- Combine with Volume: A sudden spike in volume near the support or resistance zone adds extra confirmation.
- Confluence is King: When multiple technical tools agree (support + RSI oversold, for example), your chances of success are much higher.
- Plan Your Risk-Reward: Mark entry, stop-loss, and target before taking the trade.
- Multi-Timeframe Confirmation: If support shows up on both daily and hourly charts, it’s stronger.
How to Trade Support and Resistance?
Trading these levels can be approached in two ways: bounce trading and breakout trading. In bounce trading, you anticipate that the price will reverse at a support or resistance level. This is best suited for range-bound or sideways markets. Breakout trading is for trend followers. Here, you wait for the price to break through a level, ideally with strong volume, and then enter the trade when the price retests the broken level from the other side. Both strategies require discipline and practice but can be incredibly profitable once mastered.
Support and resistance can be used for both bounce trades and breakout trades.
Bounce Trading:
- When price approaches support, prepare to go long (buy).
- When price approaches resistance, prepare to short (sell).
Add extra confirmation using:
- Candlestick patterns (Doji, Hammer, Engulfing).
- RSI divergence.
- MACD crossovers.
Breakout Trading:
- Wait for price to close beyond the support or resistance level.
- Look for a retest of the broken level (support becomes resistance or resistance becomes support).
- Enter after retest confirmation.
Both strategies have their place. Bounce trades work best in a sideways market, while breakout trades shine during trends.
How Accurate are Support and Resistance?
No trading concept, including support and resistance, is 100% accurate. But with experience, you can develop an edge.
Factors affecting accuracy:
- Timeframe: Higher timeframes like Daily and Weekly have more accurate levels than 5-minute or 15-minute charts.
- Volume: If reversals occur on high volume, the level is strong.
- Multiple Touches: More the number of touches, the more reliable the level.
- Confluence: If a support or resistance level aligns with Fibonacci, trendline, and moving average, the reliability is extremely high.
Advanced Techniques for Support and Resistance
If you want to add more depth to your strategy, advanced techniques like Order Flow Analysis can provide valuable insights. These tools allow you to see where large traders are placing their orders. Price Action Patterns such as double tops, double bottoms, flags, and head-and-shoulders also revolve around the concept of support and resistance. Major news events, earnings reports, and policy announcements can also create new temporary support and resistance levels. Keeping an eye on these can give you an edge over the average retail trader.
If you want to go one step further, consider these advanced methods:
- Order Flow Analysis: Tools like Market Depth, Level 2 Data, or Footprint charts can help you spot hidden support and resistance by showing actual buy/sell orders.
- Price Action Patterns: Support and resistance often interact with chart patterns like double tops, double bottoms, flags, pennants, and head and shoulders.
- Event-Based Levels: Earnings reports, RBI policy announcements, global market news, and geopolitical events can create new short-term support and resistance zones.
FAQ: Support and Resistance in Stock Market
Q1. What is Support in the Stock Market?
A: Support is a price level where a stock or index tends to stop falling and often bounces back upward. This happens because traders believe the asset is “cheap” at that level, so buying interest increases, creating demand and stopping the price from falling further.
Q2. What is Resistance in the Stock Market?
A: Resistance is a price level where a stock or index struggles to break above. When the price reaches this level, many traders choose to sell, which increases supply and prevents the price from rising beyond that point.
Q3. Why are Support and Resistance Important?
A: Support and resistance levels are essential for technical analysis. They help traders identify possible entry and exit points, manage risk, and predict future price movements more confidently.
Q4. Can Support Become Resistance and Vice Versa?
A: Yes! This is known as a “role reversal.” Once the price breaks below a support level, that level can act as resistance during future price rallies. Similarly, once the price breaks above a resistance level, it can become a new support.
Q5. How Can I Identify Support and Resistance Levels?
A: Traders use various tools to spot these levels:
-Historical price charts (horizontal lines at previous highs and lows)
-Moving averages
-Fibonacci retracements
-Trendlines
-Volume profile zones.
Q6. Do Support and Resistance Work for All Timeframes?
A: Yes, but their reliability depends on the timeframe. Support and resistance on higher timeframes (daily, weekly, monthly) are usually more powerful compared to lower timeframes (5-minute, 15-minute) because more traders are watching those levels.
Q7. Is Support and Resistance a Guarantee?
A: No, support and resistance are not guaranteed levels. They act as psychological zones where the price is likely to react, but strong news, earnings, or market sentiment can break these levels.
Q8. How Do Traders Use Support and Resistance in Trading?
A: Traders often:
Buy near support levels.
Sell near resistance levels.
Use breakouts for entry when price moves strongly above resistance or below support.
Place stop-loss orders just beyond these levels to manage risk.
Conclusion
Support and resistance are the most fundamental tools for every trader. Mastering them gives you a strong foundation in technical analysis. The more you practice identifying and trading these levels, the more intuitive it becomes. Remember, trading is about probabilities, not certainties, and support/resistance helps stack those probabilities in your favour. Always keep refining your chart-reading skills, and over time, you’ll develop the trader’s eye to spot profitable opportunities with confidence.
Disclaimer:
The information provided in this article is for educational and informational purposes only. It is not intended as investment advice or a recommendation for any particular strategy, stock, or financial product. Stock market investments are subject to market risks. Please consult a qualified financial advisor before making any investment decisions. The author and the website are not responsible for any losses incurred based on the content presented above.
As per the guidelines set by the Securities and Exchange Board of India (SEBI), please ensure compliance with all applicable regulations and laws while trading in the Indian financial markets.