Nifty Analysis Overview: An analysis of market trends based on the above critical levels.
Despite the overall bullish sentiment, experts advised caution as April 2 approaches, bringing uncertainty due to upcoming reciprocal tariffs. Investors may prefer to wait for more clarity on the tariff situation before making major investment decisions.
On the technical side, analysts noted that if Nifty manages to break past 23,400, it could move towards 23,800 in the near term. On the downside, key support is seen around the 23,200-23,250 zone.
Among individual stocks, Jindal Stainless saw a 3 percent decline after a leading domestic brokerage revised its target price lower, citing weak export demand and increased imports, which are putting pressure on the company’s margins.
Meanwhile, GAIL surged 5 percent following new developments regarding changes in the Natural Gas Pipeline Tariff Regulations. The regulatory board has invited public comments on the proposed amendments, with a submission deadline set for April 11.

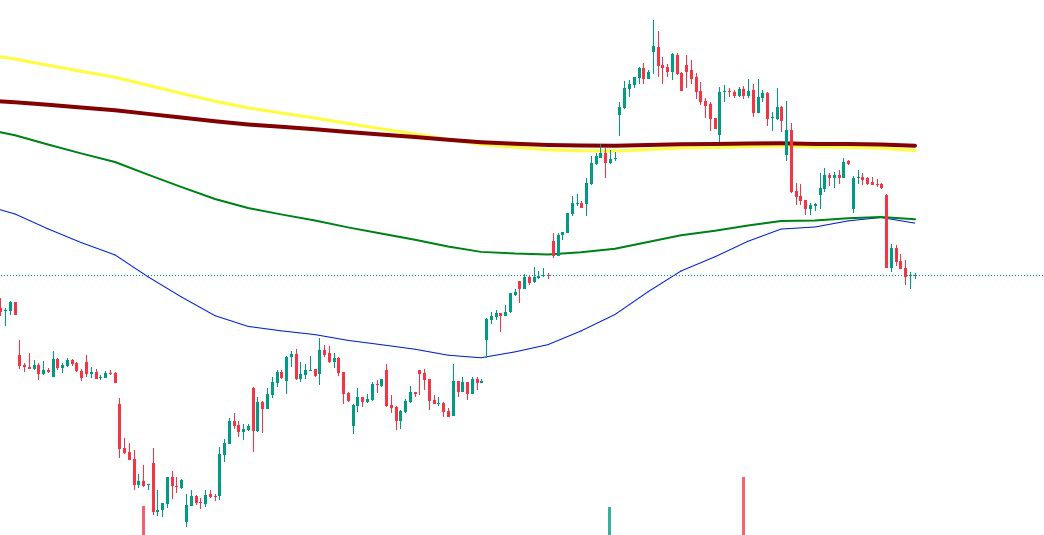
4. Technical Analysis (Charts & Indicators)
support and resistance levels.
- Analyze the trend: Is the market in an uptrend, downtrend, or range-bound?
- Check technical indicators like:
- RSI (Relative Strength Index) – Overbought (>70) or Oversold (<30)?
- MACD (Moving Average Convergence Divergence) – Bullish or Bearish crossover?
- 50 & 200 EMA (Exponential Moving Averages) – Is Nifty above or below them?
- Identify any chart patterns (Head & Shoulders, Double Top, Triangle, etc.).
📌 Example:
“Nifty 50 is currently in an uptrend and has closed above the 50 EMA, indicating strength. The RSI is at 65, suggesting bullish momentum. However, resistance is seen at 19,900, and a breakout above this level could lead to further upside. MACD is showing a bullish crossover, confirming the trend.”
5. Options Data Analysis (Derivative Insights) 📊
-
- Open Interest (OI): Where are traders placing their bets?
-
- Identify the highest Call & Put OI – This shows key resistance and support levels.
-
- Put-Call Ratio (PCR):
-
- PCR > 1 = Bullish sentiment
-
- PCR < 1 = Bearish sentiment
-
- Put-Call Ratio (PCR):
-
- Implied Volatility (IV): Higher IV means increased uncertainty.
📌 Example:
-
- Highest Call OI: 19,900 (Strong Resistance)
-
- Highest Put OI: 19,700 (Strong Support)
-
- PCR: 1.15 – Indicates slight bullish bias.
6. FII & DII Activity (Institutional Buying & Selling) 🏦
-
- Track Foreign Institutional Investors (FII) and Domestic Institutional Investors (DII) activity.
-
- Are they buying or selling? Their actions can influence the market trend.
📌 Example:
-
- FII Net Buy: ₹1,500 Cr
-
- DII Net Sell: ₹800 Cr
-
- Net Institutional Flow: Positive, indicating buying pressure.
7. Market Sentiment & News Impact 📰
-
- How is global sentiment affecting Nifty?
-
- Are there any major economic data releases, RBI policies, or geopolitical events impacting the market?
-
- Check how international indices like Dow Jones, Nasdaq, and SGX Nifty are performing.
📌 Example:
“Global markets remained mixed as the US Federal Reserve hinted at potential rate hikes. SGX Nifty is indicating a flat start for tomorrow. Oil prices surged 3%, which could impact Indian markets.”
8. Tomorrow’s Outlook & Trading Strategy 🎯
-
- What can traders expect tomorrow?
-
- If the market is bullish, mention breakout levels.
-
- If bearish, mention key support levels.
-
- Suggest whether traders should look for buy-on-dips or sell-on-rise opportunities.
📌 Example:
🚀 Bullish Scenario: If Nifty breaks 19,900, it could head towards 20,000.
📉 Bearish Scenario: If Nifty falls below 19,700, a correction to 19,500 is possible.
💡 Trading Strategy: Wait for confirmation before taking positions.
💡 Example of a Complete Nifty Daily Analysis
🔹 Nifty 50 Today: Bulls Back in Action – [Date]
✅ Market Summary:
-
- Nifty 50 closed at 19,850, up 120 points (+0.6%).
-
- IT and Banking stocks drove the rally.
📊 Key Levels:
-
- Support: 19,700
-
- Resistance: 19,900
📈 Technical Analysis:
-
- RSI at 65, indicating strength.
-
- MACD shows bullish crossover.
📊 Options Data:
-
- Call OI Build-up: 19,900
-
- Put OI Build-up: 19,700
🏦 FII/DII Activity:
-
- FII bought ₹1,200 Cr in Indian equities.
📰 Market Sentiment:
-
- SGX Nifty flat, global cues remain uncertain.
🔥 Tomorrow’s Outlook:
-
- Above 19,900: Expect bullish momentum 🚀
-
- Below 19,700: Weakness may continue 📉
Final Thoughts: Stay cautious and follow levels closely. 🚀📊